Nucleome Browser: An integrative and multimodal data navigation platform for 4D Nucleome
Nucleome Browser is an interactive, multimodal data visualization and exploration platform to integrate heterogeneous datasets (e.g., genomic data, imaging data, and 3D genome structure data) and external data portals by a new adaptive communication mechanism. Nucleome Browser provides a scalable solution for integrating massive amounts of 4D Nucleome data to navigate multiscale nuclear structure and function in a wide range of biological contexts, enabling hypothesis generation and data sharing with the broad community.
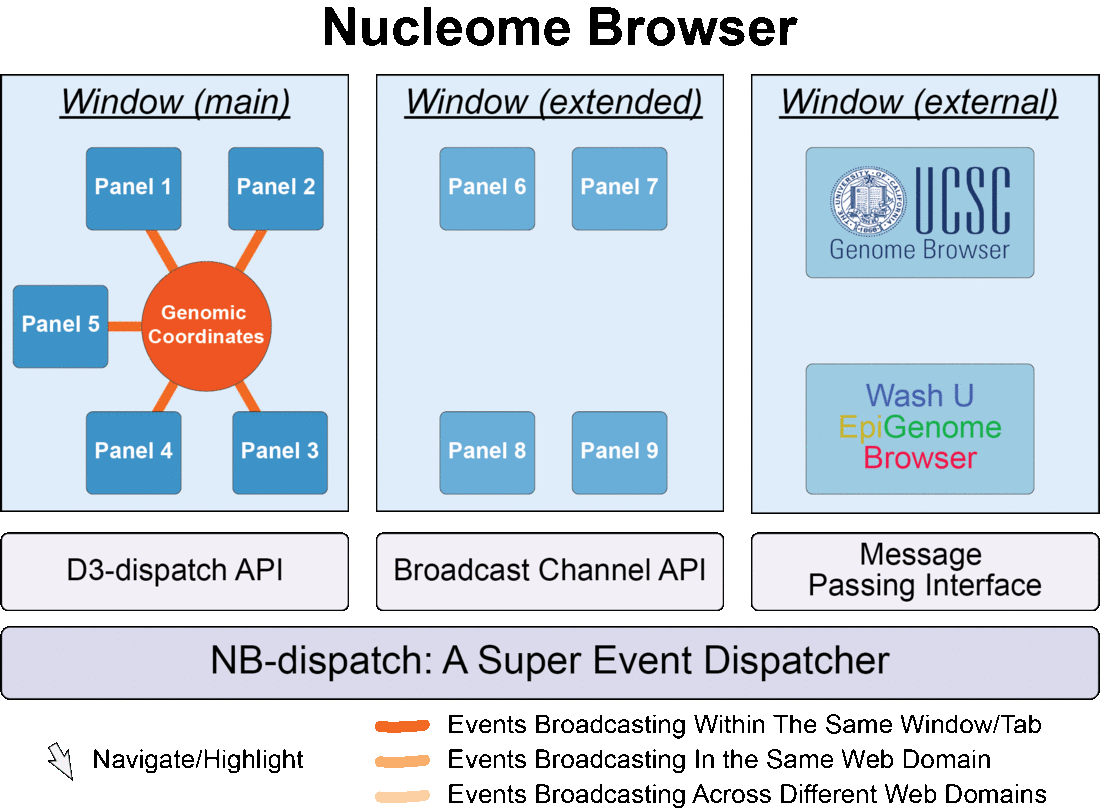
Fig. 1 Nucleome Browser consists of multiple configurable, communicable, and composable web components (panels) for visualization of multimodal data. Operation in any panel will be synchronized to all connected panels, external data portals including UCSC Genome Browser and WashU Epigenome Browser, and custom web applications tailored towards specific data types.
Quick Start
To try Nucleome Browser, go to the main portal of Nucleome Browser at http://vis.nucleome.org. You can find all the resources related to the platform including examples of pre-configured browser sessions, documentation, a Slack channel for discussion and reporting issues, etc.
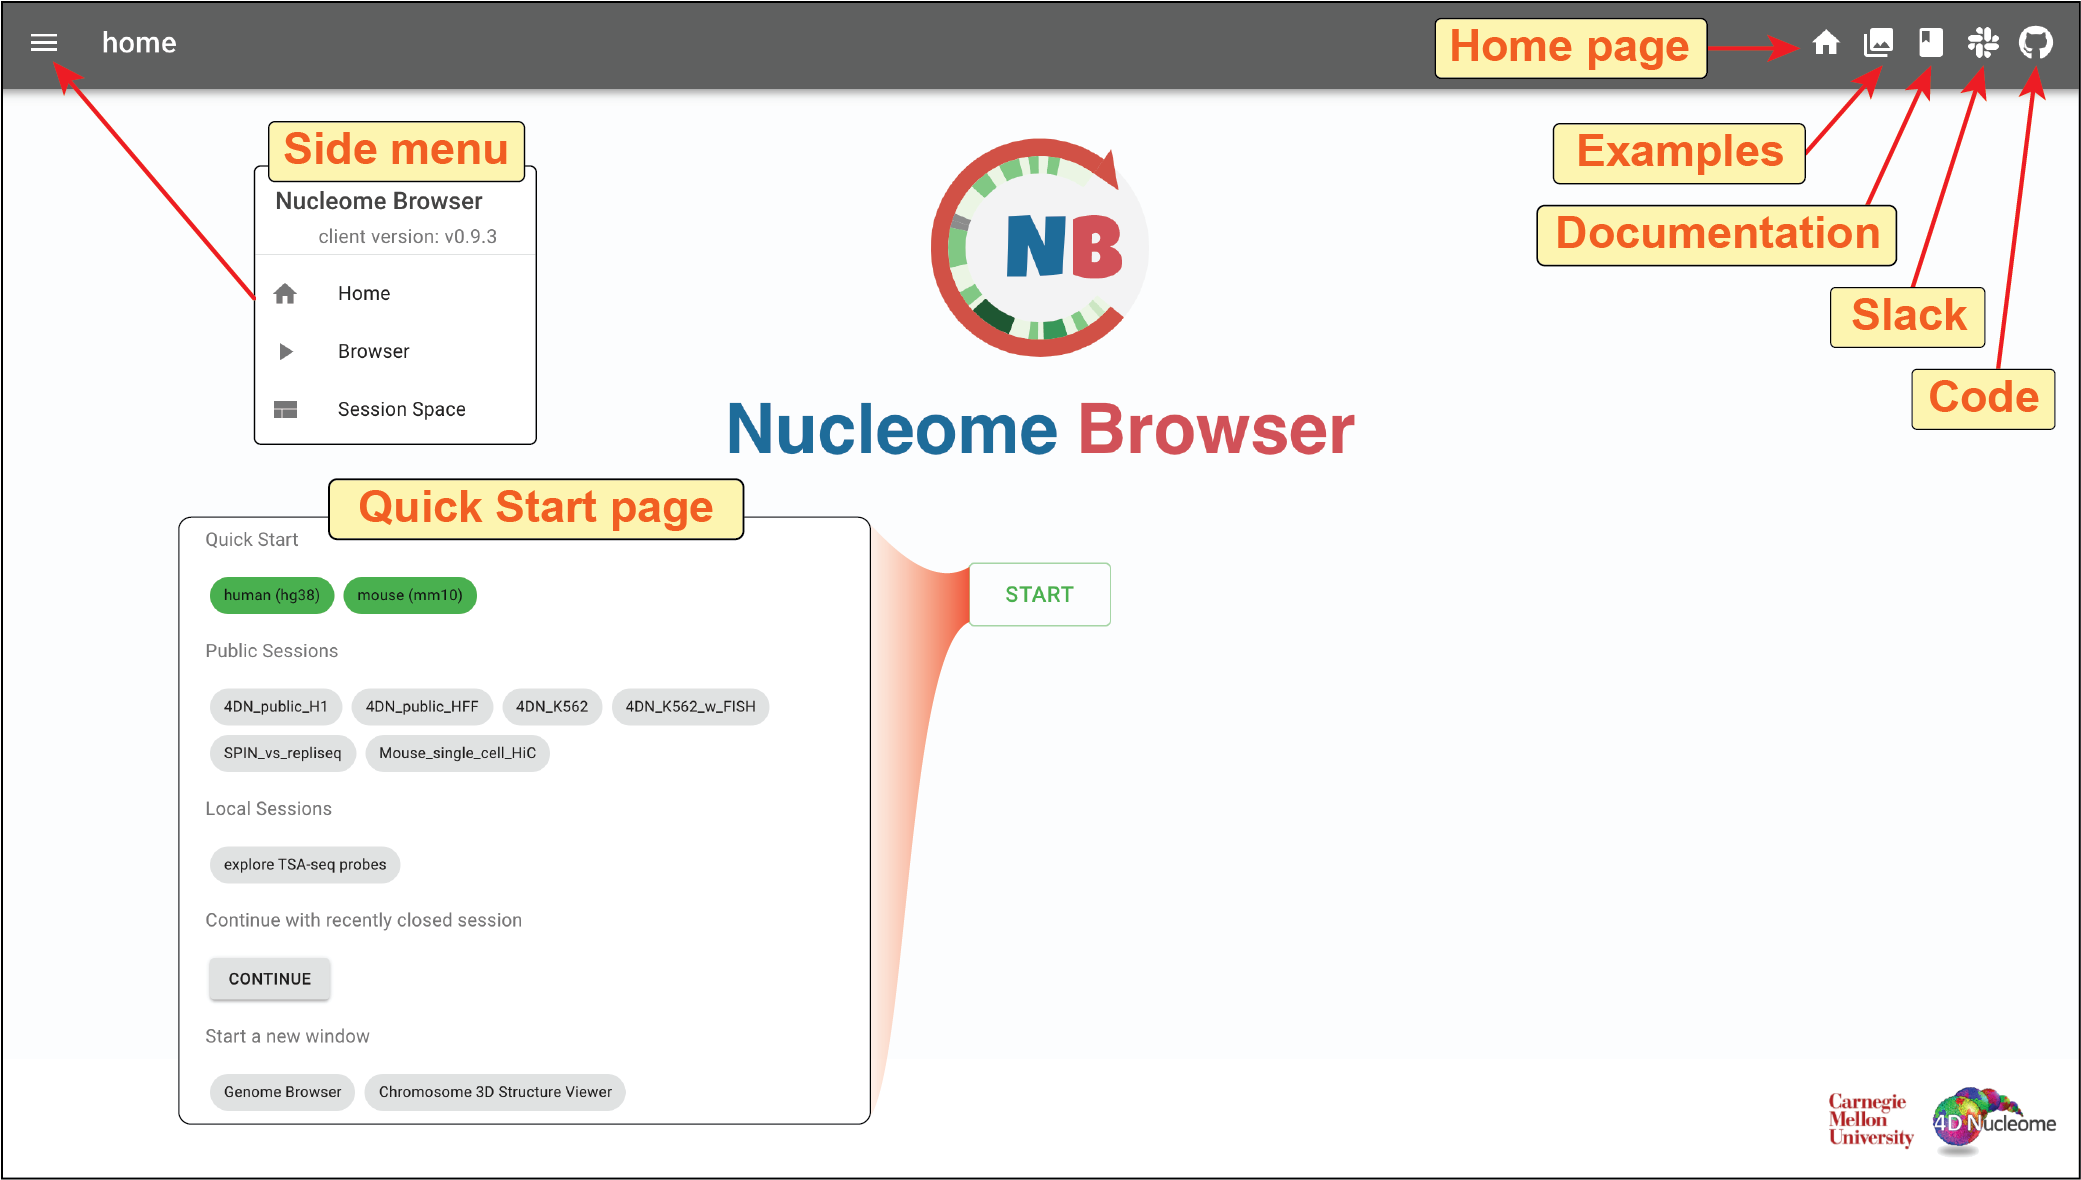
Fig. 2 Home page of the Nucleome Browser
Clicking the Examples button (![]() ) on the top-right toolbar on the home page, you will see a series of thumbnails of browser sessions.
You can explore those examples by clicking the
) on the top-right toolbar on the home page, you will see a series of thumbnails of browser sessions.
You can explore those examples by clicking the enter button (![]() ).
For example, you will see a browser session illustrating a comparison of the 3D nuclear organization between K562 and H1 cells in the Multimodal integrative analysis example shown below,
).
For example, you will see a browser session illustrating a comparison of the 3D nuclear organization between K562 and H1 cells in the Multimodal integrative analysis example shown below,
Two genome browser panels on the left show various genomic data from K562 and H1, including Hi-C contact matrices, TSA-seq, and DamID tracks mapping to multiple nuclear bodies (e.g., nuclear speckles, nuclear lamina, and nucleolus), and replication-timing profiles. On the right, two 3D structure panels are illustrating two 3D structural models with color representing TSA-seq signals on Lamina B1 in H1 and K562, respectively. Highlighted regions show a cell type-specific LAD/late-replication (K562) to inter-LAD/middle-replicating (H1) transition (green rectangle on the left) and a conserved LAD (blue rectangle on the right) as indicated with TSA-seq, DamID, and high-resolution replication timing Repli-seq tracks. It is also possible to explore imaging data using the Nucleome Browser. In the middle genome browser panel for K562, you can see an image track showing DNA FISH data. The target region of each probe is represented by a blue bar. Clicking on one image, an OMERO.iviewer window will pop out allowing you to further explore the image using the OMERO.iviewer tool.
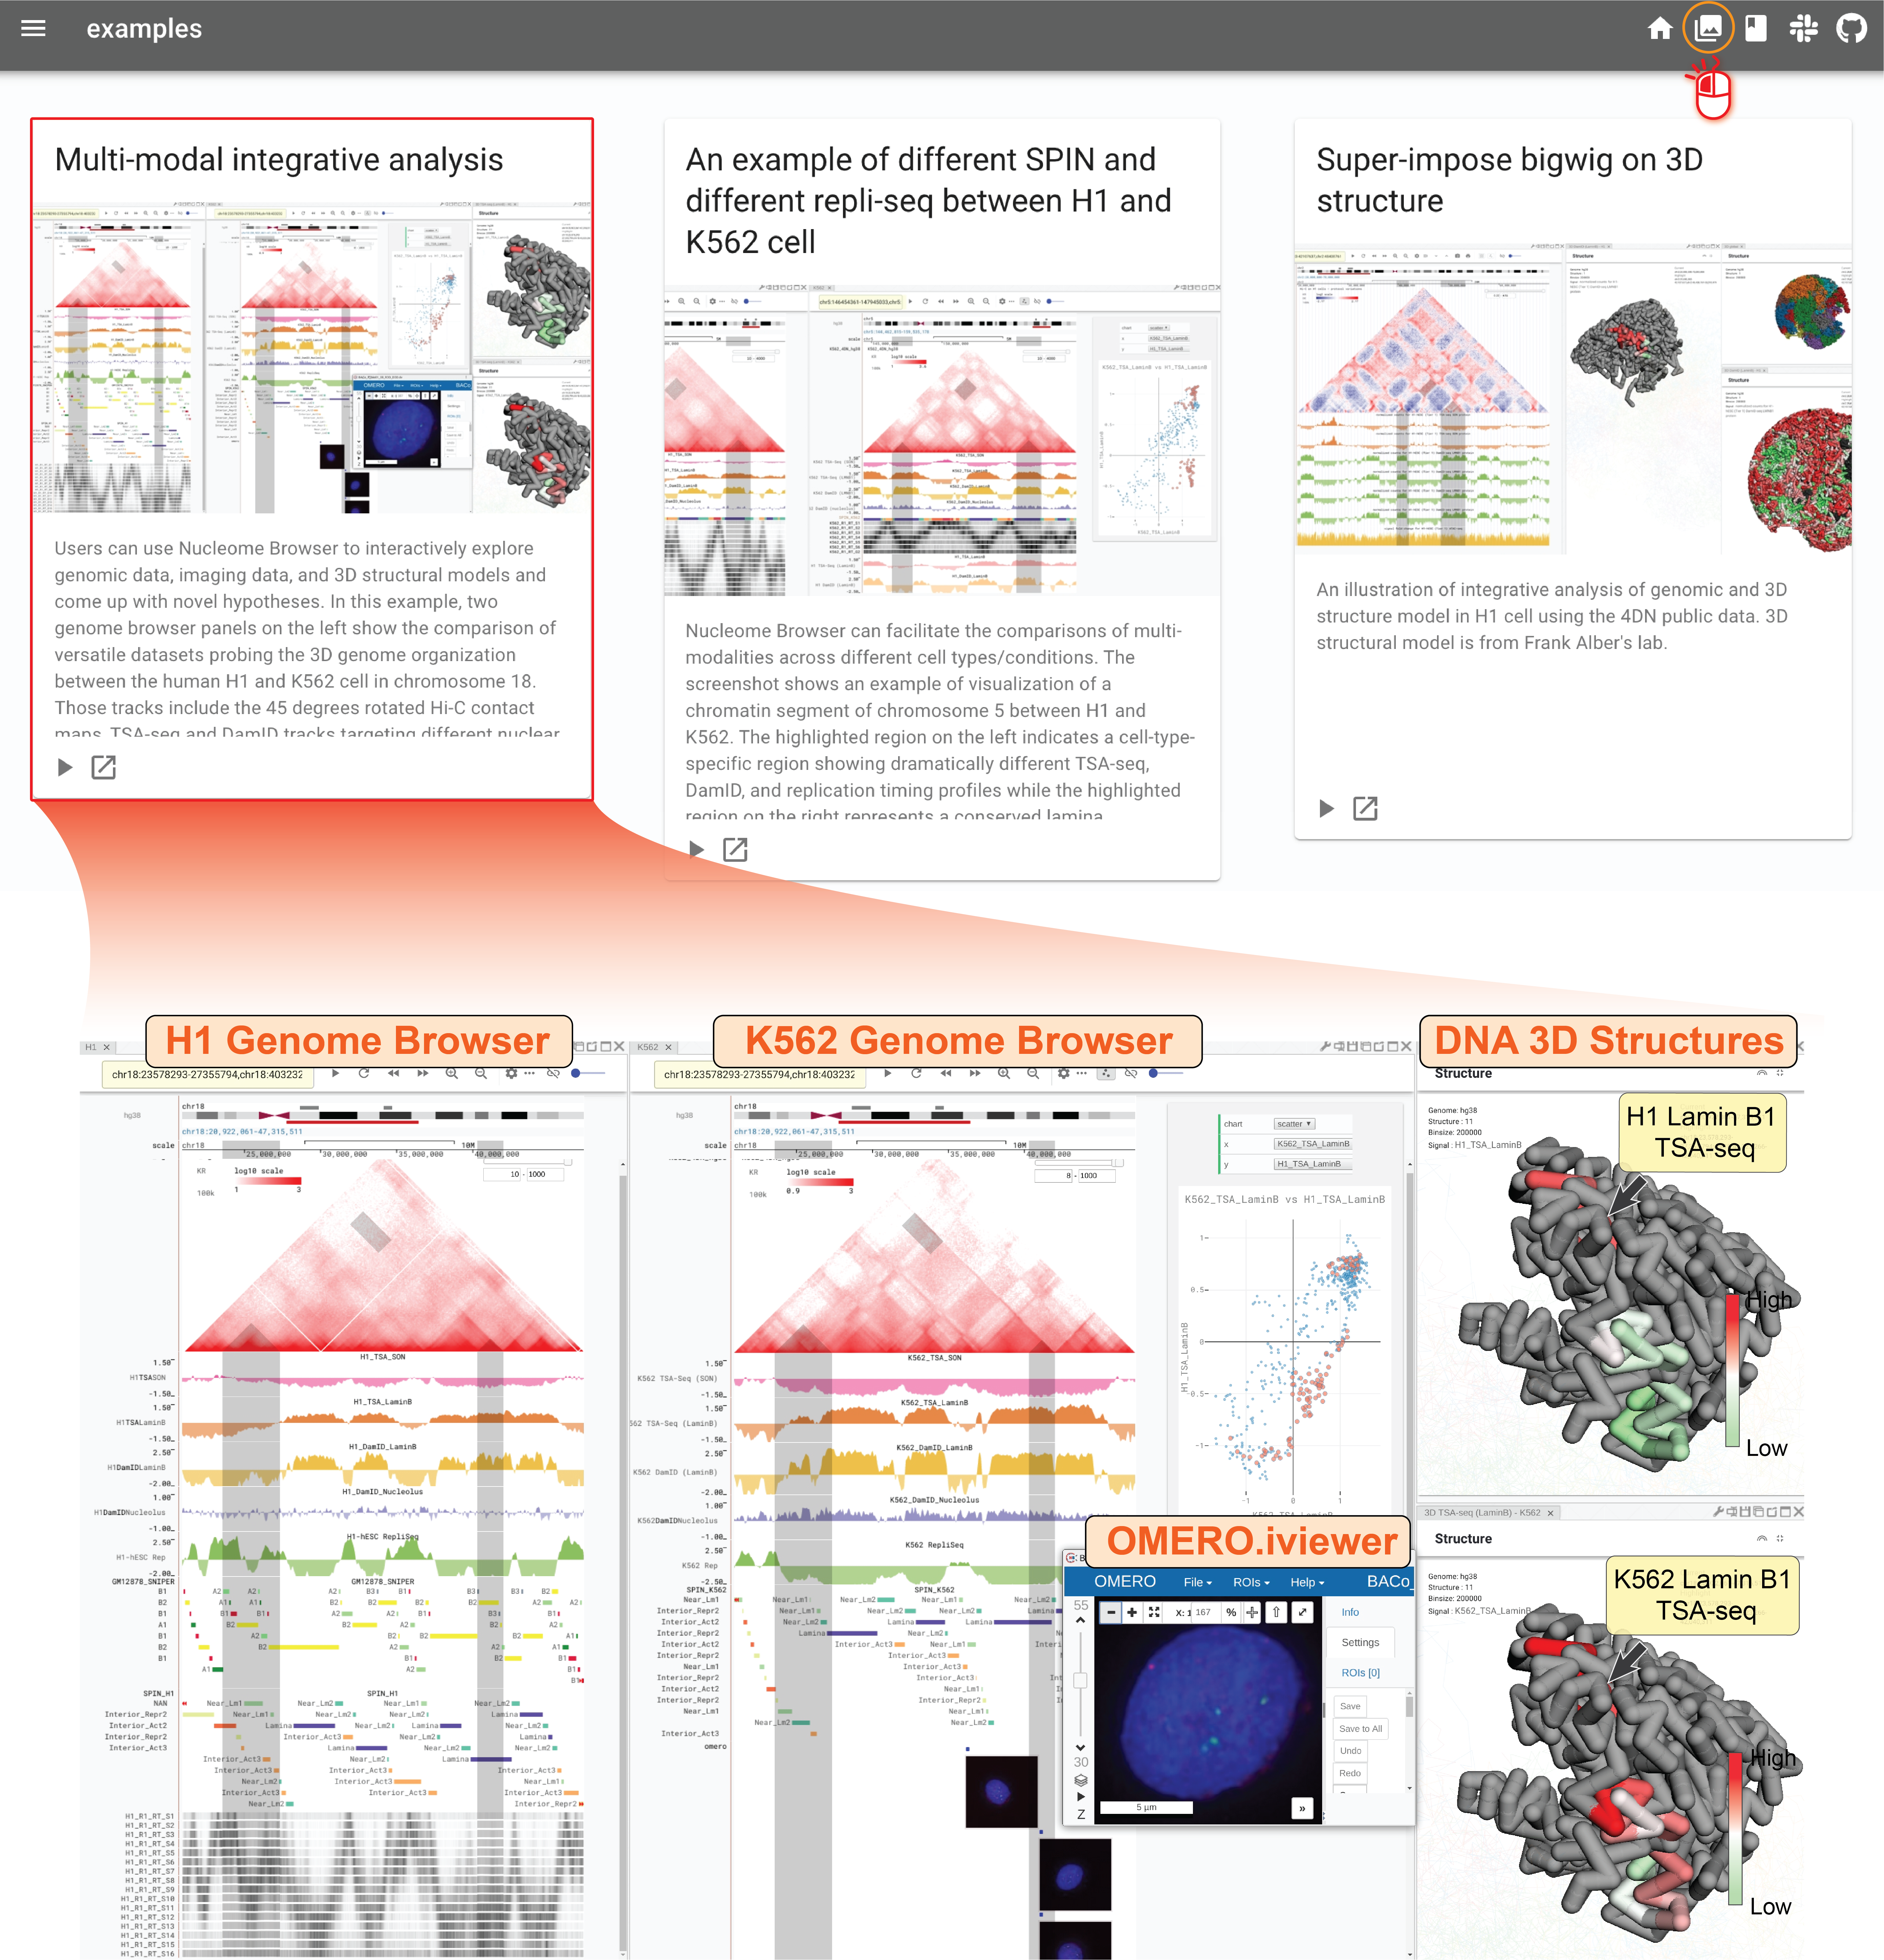
Fig. 3 Nucleome Browser facilitates interactive exploration of multi-modal data