Other components
Google Sheet viewer
Sometimes you may already have a list of regions that they want to inspect, such as a list of ChIP-seq peaks, differentially expressed genes. However, go through abundant regions one by one by copying and pasting genomic coordinates is both time-consuming and inefficient. Formating interesting regions into a bed file and plotting it as a track can provide a global profile of region-of-interest but still cannot solve the problem of efficient exploration of an individual region. Here, we provide a novel web component called Google Sheet viewer that can efficiently connect Genome Browser with a list of regions.
This tool requires users to save a list of regions onto the Google Sheet following simple format guidance as shown below. After the Google Sheet is shared with the public by link, you can copy and paste the sheet ID into this web component. It will automatically load the data and you can go through these regions by clicking one region (row) or moving up and down in the table using arrow keys. Notably, all other connected panels will upstate their content automatically as you change the currently selected region.
Google Sheet format requirement
- The first row is a header about the column’s name
- The name of the first column is Title and the name of the second column is Regions
- You can add more annotation in other columns
- Put the label of each region under the Title column and make sure that the label is unique for each row.
- Genomic coordinates in the Regions column should be format as chrom:start-end (1-base)
Clicking the plus button (![]() ) on the top menu bar and selecting the
) on the top menu bar and selecting the Google Sheet or TSV component you will see the default interface of the Google Sheet viewer.
You can load demo data by clicking the load demo button.
Next, you can use the mouse or the arrow keys to go through the region list.
You can also search a region by its label using the region viewer shown at the bottom.
It also supports multi-region visualization by using a comma to separate multiple regions.
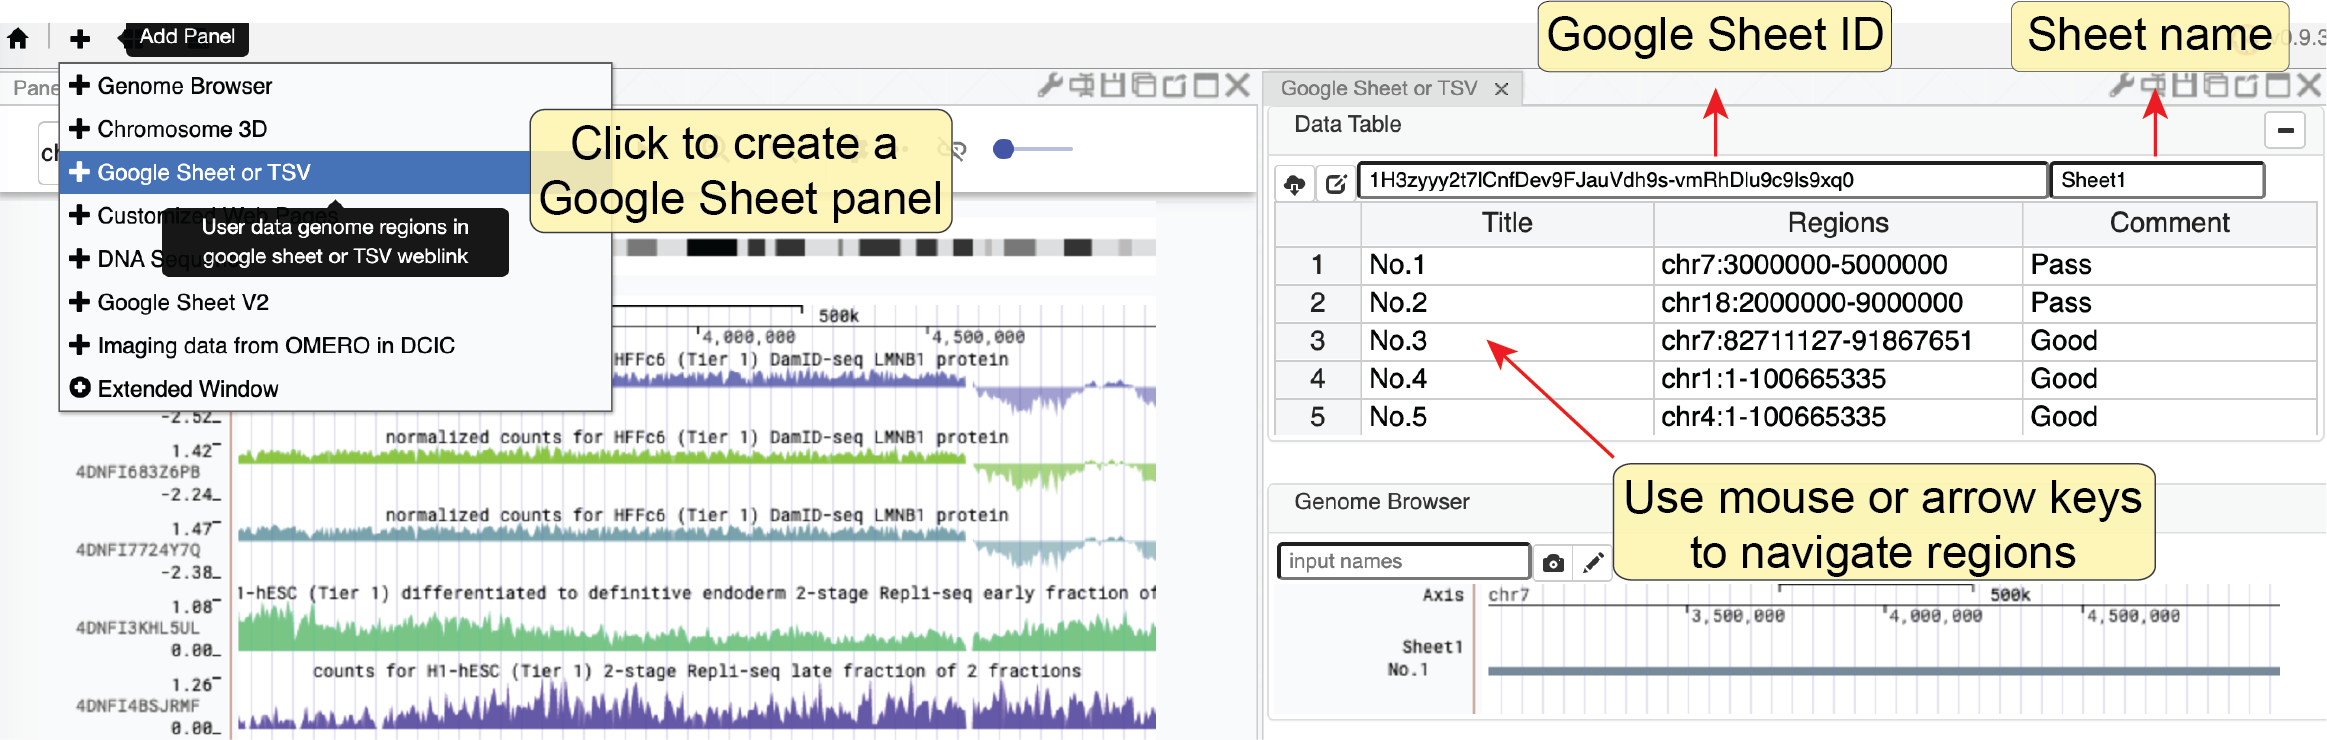
Fig. 44 Use the Google Sheet web component to explore the region of interest
Fetch DNA sequence
We created a web component to allow users to get the DNA sequence of the currently viewed region. It can only show the DNA sequence if the region’s length does not exceed 10000 base pairs. Notably, when multiple regions are being viewed, this tool will show the DNA sequence of each region separately.
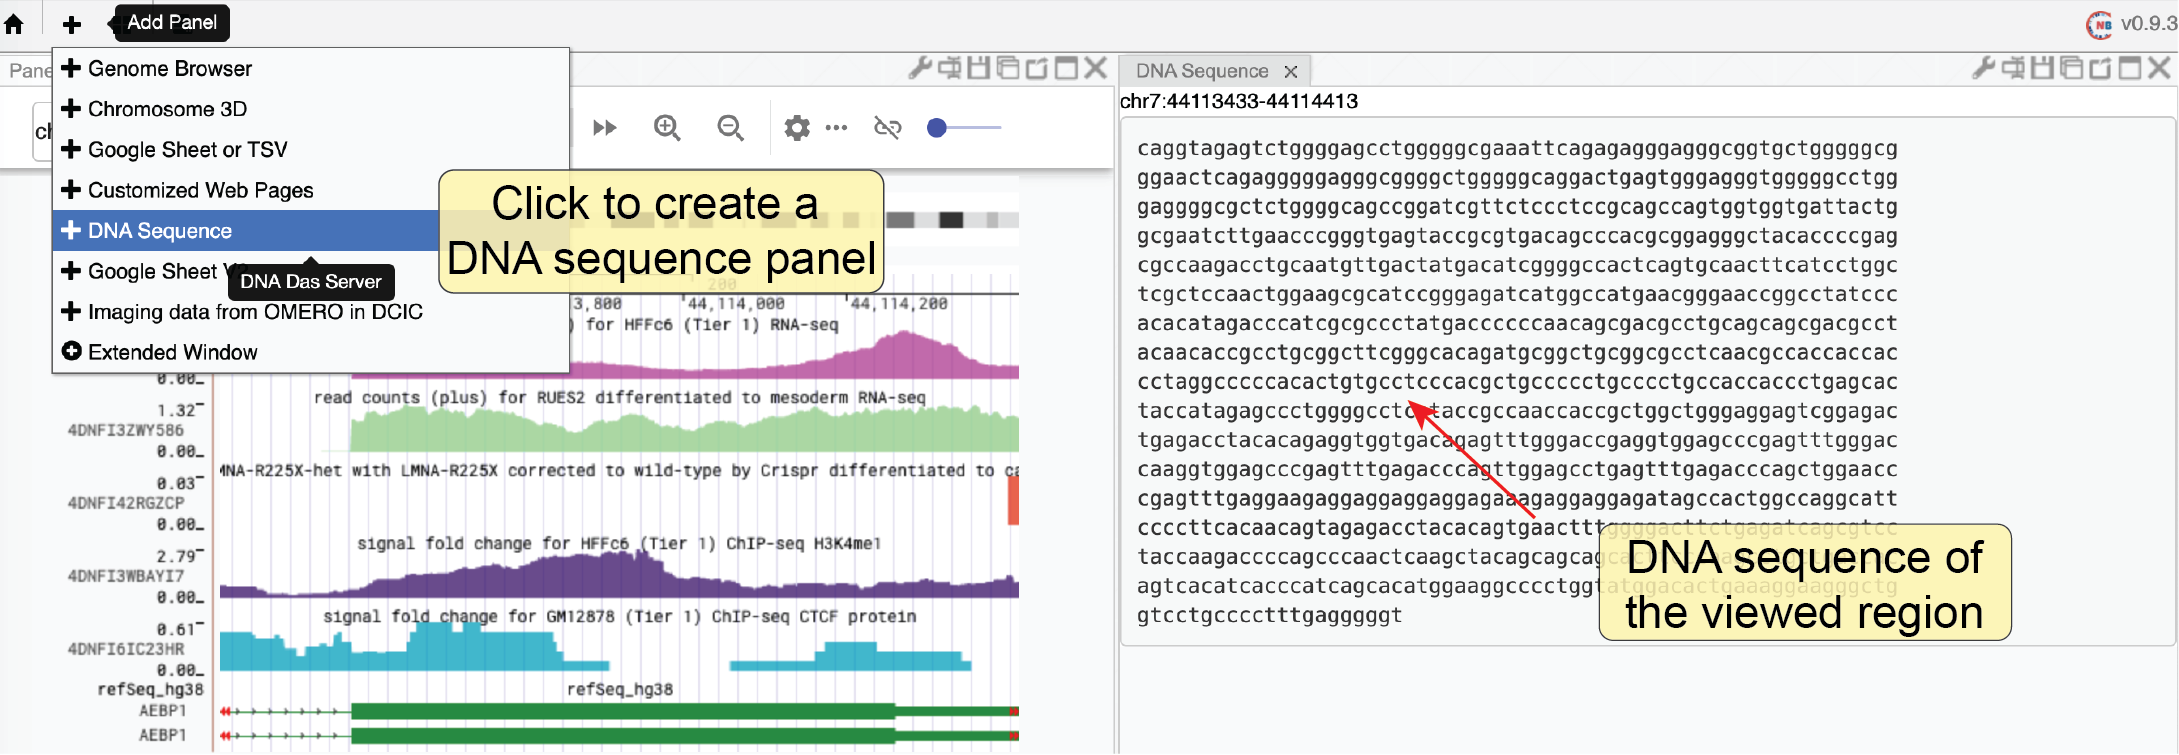
Fig. 45 Fetch the DNA sequence of the currently viewed region (< 10000bp)
4DN DCIC imaging data
The 4DN Data Coordination and Integration Center (DCIC) currently hosts abundant imaging data using an OMERO server. We have parsed the meta-information of those imaging data and stored that information if an image is labeled to specific genomic coordinates (e.g., DNA FISH data). In this web component, each track represents one imaging experiment. The red bars on top of a track indicate the target of each experiment such as the genomic region targeted by FISH probes. Different images taken in one experiment are shown as a list of clickable thumbnails. You can view the raw image on the OMERO.iviwer by clicking the thumbnail or explore the details of this data on the DCIC website by clicking the number icon associated with each image.
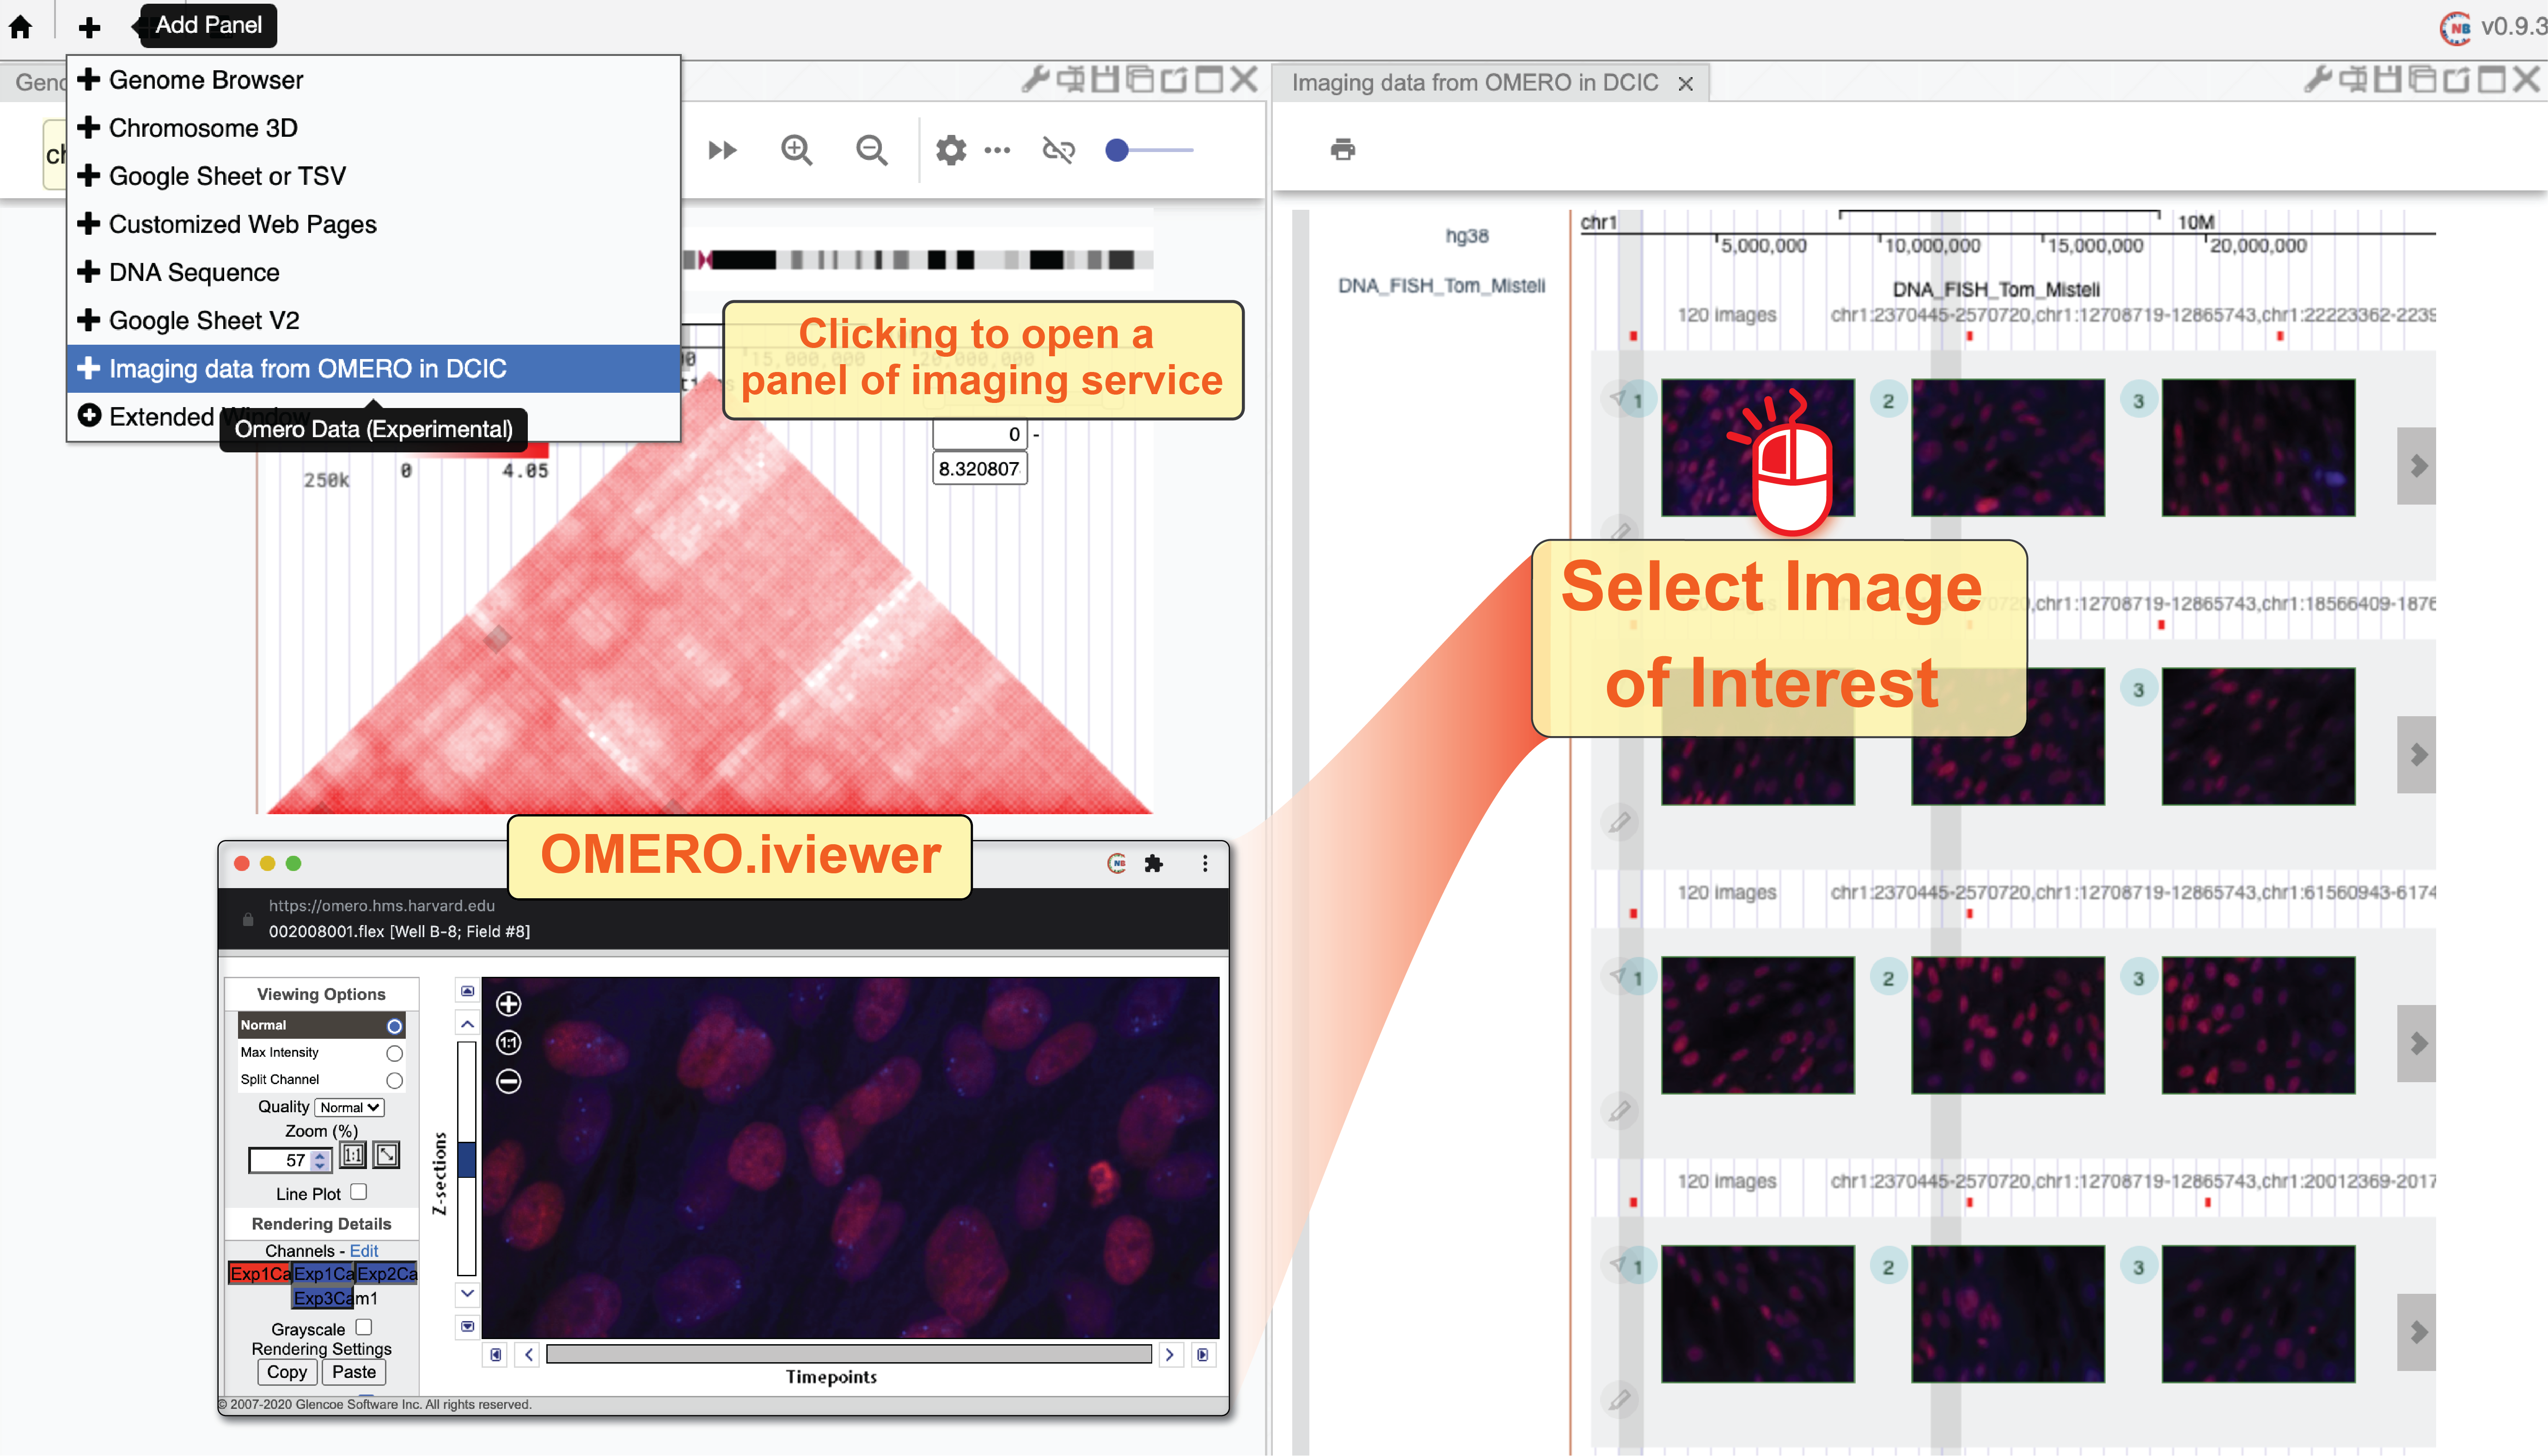
Fig. 46 Use the DCIC image web component to view imaging hosted on the 4DN DCIC data portal